24 Oct 2015
I’m excited to announce that starting in November, I will be joining thredUP as a Data Scientist in San Francisco!

Everyone on the team is bright, motivated and positive - exactly the kind of people I want to work with! Furthermore, thredUP’s mission to encourage shoppers to think secondhand first really resonates with me, and I am proud to have the opportunity to contribute to it!
I am also excited to be moving to San Francisco. While I feel happy and energized to be working alongside others who share the same passion I have for technology, I recognize that techies aren’t the only residents of the city. To me, that means keeping an open mind always and knowing that I have more to contribute than the work I do for my company.
Cheers to new beginnings! 
03 Oct 2015
A few days ago, I was presented with a mini-case about attribution modeling. It was the first time I had heard the term. The question presented was essentially: How to distribute $$ among different ad channels? The part that makes this question not so straightforward is that people may view an ad multiple times on various platforms before finally deciding to click, and they may also visit the site a few times before finally deciding to convert. Many variations of this behavior is possible.
The case was so interesting that I kept thinking about it later that night, so I decided to build a NetLogo model to help me better understand it. Please note that this is my first foray into attribution modeling, and I’ve not yet read anything on the topic, so my ideas may likely be elementary.
Setup
For simplicity, I chose to model only 2 channels. Each channel has 3 states (“view”, “click”, and “convert”), and they are linked via directed links, which represent transitions. Each link has a label which shows the transition probability. Some more design choices/assumptions:
- 100% of a channel’s visitors sees the ad, so the number of visitors is really the number of views, since ads are usually priced per view
- Each person has the same behavior
- For each state, there is a probability that the user stays in that state (in reality, this probability is quite high, I would assume…) ; in my model, the user can set this value from the interface
- Provided with infinite time, eventually everyone converts (woah)
- A user can see and the ad on either page before clicking (i.e., the links between the 2 “view” states are reflexive)
- There is no way to distinguish a view with intent to click (i.e., the transition probabilities remain the same for someone seeing the ad for the hundreth time as the first time)
Here is what a model looks like after setup, and after it has finished running:
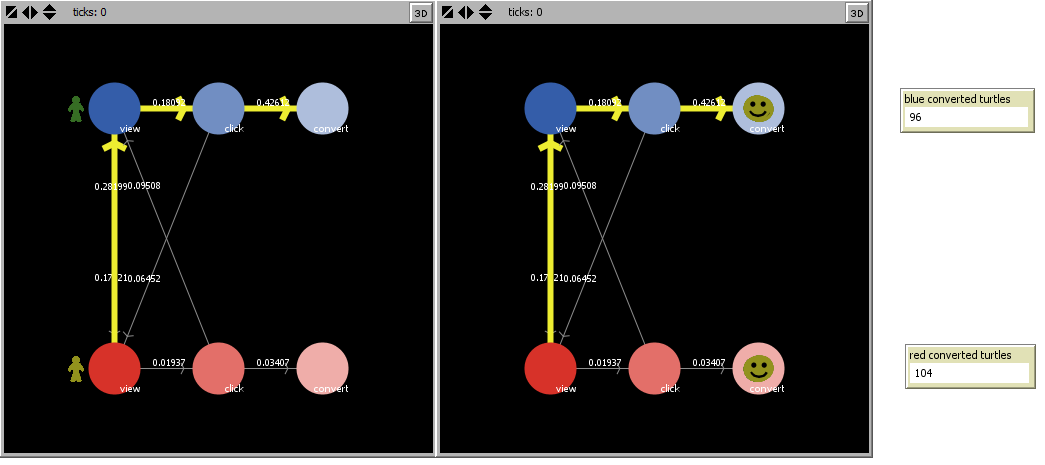
Both channels have the same number of views (100). Interestingly, the red channel is responsible for more conversions even though the most likely path points to the blue channel as the more superior one, though the difference is quite small.
Thoughts
There are infinite different most likely paths if nodes can be visited more than once, but if they can only be visited once, then there are 8. Here are the distinct shapes that the most likely path can take:
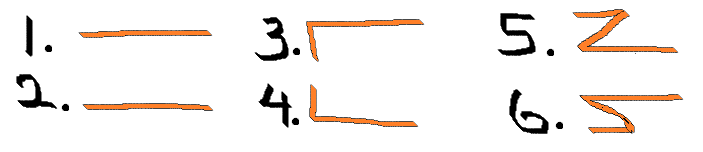
(MS Paint ftw)
We assume that the composition of the visitors to both channels are the same. Patterns 1 and 2 show a clear dominance of the first channel over the second. The second set of patterns is more interesting because the majority is clicking the ad on one channel, despite seeing an ad for the same service/company on the other. Depending on how significant the difference is, this indicates that the ad is more effective on one channel, whether due to the ad content or the channel’s targeting. The final set of patterns is a bit more complex. More people click on the ad on one channel, but this doesn’t lead to a conversion until they see it again on another channel. If the landing pages of the two ads were different, this could explain the pattern.
Although we understand behavior better now, the main question is still unanswered - how to distribute an investment between the two channels? If one channel is clearly superior, then we would want to invest all of our marketing dollars on that one, but this leaves us vulnerable if something changes. This is where the task started to sound like the Bayesian bandit, a Bayesian approach to the multi-armed bandit problem. A good explanation of the Bayesian bandit can be found here. Basically, as more evidence accumulates, the distribution converges to the true underlying distribution. In our example, we can take the same approach - start by dividing our budget between the two channels, and then adjust based on the effectiveness of each channel. Adjustments should be made as regularly as the channels will allow.
The most important question is how to determine the effectiveness. We don’t simply want to consider the conversion rate, because the channel driving the conversion rate may not be the channel that is responsible for most of the conversions. A potential method is a count the number of links attributed to each channel. So, for example, patterns 1 and 2 have two links each, while pattern 5 gives one link to channel 1 and two to channel 2. The optimum design of the effectiveness score can be revealed with repeated testing. Additionally, we can use the most likely path to diagnose potential problems that can be controlled.
The model presented here is very simple, and we can imagine that more insights can be derived using a model with more than 2 channels (perhaps I’ll come back to this later). My interpretation of each node being the first visit to the particular state could possibly be improved upon. All in all, this has been quite an engaging project and I’m happy to have been introduced to it. Questions like this make me feel very grateful to be in the analytics field!
The code for this model can be found here.
If you have any feedback or questions for me, please shoot me an email at melodyyin@u.northwestern.edu. Thank you!
23 Sep 2015
Last night, I finished the final lesson of Udacity’s Hadoop/MapReduce course, built by Cloudera. This is the second Udacity course I have completed; the other one was Intro to A/B Testing, created in collaboration with Google.
Overview
The course took me about five days to complete (note: I did not do the final project). The first 2 lessons are lectures that go over the basics of Big Data, HDFS and the MapReduce framework. Each lesson contained short quizzes as you go through the videos as well as a “Problem Set”, which is a longer quiz reviewing the corresponding lesson’s materials. Since I had zero knowledge of the Hadoop ecosystem, I learned a lot from this simple intro.
Lesson 3 was about writing mappers and reducers. Cloudera provides a pseudo-distributed environment where you can run your code as well as the ability to code in Python instead of Java through Hadoop Streaming. The Project for this lesson contains 6 problems you will have to run on your virtual machine; starter code is provided. This part took me a few hours, but helped me to better understand how MapReduce works. Lesson 4 introduced filtering, summarization and structural design patterns as well as combiners, which can serve as an intermediate step between the mapper and reducer to reduce processing time. No project in this lesson, but there were 6 tasks that applied the patterns mentioned.
My Thoughts
All in all, I enjoyed taking the course and it was a good primer to working with Hadoop. Writing MapReduce code and testing on real(ish) datasets was a great learning experience. The only problem, which I observed in the A/B Testing course as well, is the vague/sometimes misleading directions and the lack of feedback for free users. Of course, one can’t expect much (/any) support since the materials are already free, but the combination can cause a bit of frustration sometimes. For example, one of the problems asked for “the mean value of sales on Sunday”, but what it actually wanted was the mean purchase value of a sale made on a Sunday. Also, I was about 2/3 of the way done with the A/B Testing final project, but there was this one question that did not accept any reasonable answers. This is why I chose not to spend time completing the final project for this course.
There is a discussion board that people can ask questions, and I’ve used this a few times to help me decipher unclear directions, but the participation is really low. The front page of the Hadoop course boasts more than 80k students, but most of the discussion board posts only have around 100 views. This makes me wonder what the student engagement level is for these courses.
TLDR;
Worth taking if… you are completely new to Hadoop and/or writing MapReduce code
You will learn… basics of HDFS and MapReduce framework, data processing in Python, working with the Linux command line
I recommend… checking for syntax errors locally before running a job to save time
If you have any feedback or questions for me, please shoot me an email at melodyyin@u.northwestern.edu. Thank you!