Creating a Compatibility Quiz With R!
18 Jul 2016Remember those quizzes that we used to take in middle school and/or high school? I remember filling out a set of questions in homeroom and receiving a short list of people that I was most compatible with and another list with my least compatible matches. These quizzes were always entertaining and my friends and I would have a lot of fun completing them and comparing our results. So, I thought it would be a great way to build camaraderie in the office and help people to get to know each other. Plus, for an extra layer of fun, I could design my own algorithm!
I went to our Office Manager, Kelly, with the idea and she was on board and just as excited as I was! We sat down with a couple of our other coworkers and created 25 questions using Google Forms. Some were multiple choice, others were on a linear numeric scale, a few were checkboxes and the last question was a short answer. The idea was to use a person’s response to determine everyone else’s relative distances, and select the top 3 closest individuals as that person’s matches. We also later decided to include the furthest match, because opposites attract, right?
To determine distance, I needed to convert all responses into some type of numerical representation, because there’s no way to find how far apart someone who chose choice A is from someone who chose choice C when the choices are categorical. On the other hand, if the choices could be converted into numerics then the multiple choice or checkbox question essentially becomes a linear numeric scale question and deriving the distance is quite straightforward. So, I sat down with Kelly again to choose a few of appropriate questions and converted their text choices to numbers. For example, one of our questions was: “Which distribution center would you work in if you had the choice?”, and we ranked the answers by distance from San Francisco.
For the remaining questions, I assigned a binary vector to each possible response. For example, if someone chose choice B and C in a checkbox question with 5 potential choices, their binary vector would be: [0 1 1 0 0]. Similarly, if someone chose choice D in a multiple choice question with 4 choices, their vector would look like: [0 0 0 1].
Next, I had to choose a distance measure that was able to handle 0/1 values appropriately, and decided on the binary/Jaccard distance, which is included in base R’s dist function. For multiple choice questions, using this distance measure meant that those who chose the same answer would have the distance 0, and those who did not would have distance 1. It worked similarly for checkbox questions, except the resulting distance could range between 0 and 1 depending on the length of the vector and the number of overlapping positions.
I had originally planned on doing sentiment analysis on the response to the short answer question, but didn’t feel it was worthwhile to spend time stemming the words, especially since most people skipped the question! Instead, I opted for a simple word count to quantify the responses to this question.
Now, each question has an n-element vector of everyone’s responses, where n is the number of participants in the quiz. Since the questions are on different scales, we normalize the responses for each question to give every one the same weight. Then, all of the matrices are summed and the final matrix looks like this:
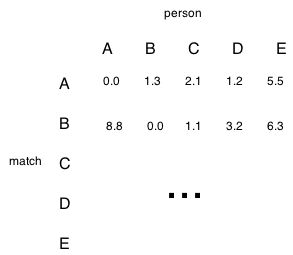
So, we can see that the best match for person A is D and the best match for person B is C.
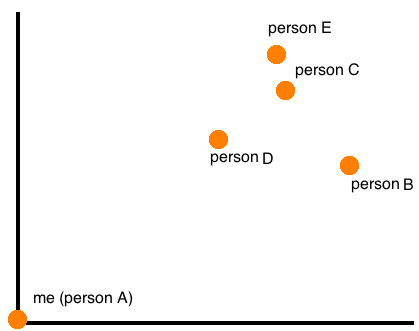
A plot of the distances can also be generated. Since distances are all relative (e.g., your distance from me is relative to where I am), each person has their own plot where they are at the origin, and it looks something like this:
Out of the 70-something people in the office, 60 people filled out the quiz and received their top 3 matches as well as their worst match. Although everyone had matches, there were around 10 people who did not show up in anyone else’s top 3. Conversely, there were a few people who dominated the worst match list, with yours truly ranking at #3 in frequency of appearance in worst match list (the irony!!! betrayed by my own algorithm :c). Overall, it was a success!
The code for the entire quiz plus the compatibility plot can be found here.
Lastly, this blog just turned 1 year old! In the past year, I wrote 11 posts and created 5 statscapades. This year, I aim to double that amount!